Overview
The weight analysis answers a question a list of individual weighings cannot: are your young animals growing the way they should, and is there a breed or an age group falling behind?
You reach the page via Reports > Weight.
Requirements
- The Weight tab only appears if your role has access to Breeding & Production.
- An animal enters the analysis when it has a date of birth and at least one weighing. Without either, the page reports «No comparable weighings yet».
- You record weights under Breeding & Production > Weight, see Recording Weights.
What the figures are based on
Herdy takes each animal's most recent weighing. That way the analysis describes your herd as it stands today, instead of blending measurements taken years apart into one average.
Each animal is assigned to the age class it was in at the time of the weighing. A lamb weighed at 200 days therefore counts towards the young stock, even if it is an adult today.
Daily live-weight gain (DLG)
Daily live-weight gain is live weight divided by age in days, expressed in grams per day. It says how fast an animal has grown since birth.
Herdy shows DLG for young stock only. In adults the figure keeps falling simply because the animal gets older: a 1.7-year-old ewe reaches around 160 g per day, an eight-year-old around 40 g, and both are perfectly normal. An average across such animals measures the herd's age, not its performance. Those rows therefore read young stock only.
The filters
- Species: chips at the top for every species that has weighings, for example Sheep, Goats, Cattle. Exactly one species is always active, because sheep and cattle on one shared kilogram axis would be unreadable.
- Breed: the selector narrows the table to one breed. The reference figure for the age class deliberately stays the figure across all breeds, otherwise the filtered breed would become its own yardstick and always look average.
Pigs have no age classes. In Switzerland they are identified as a group rather than individually, and the official categories follow the production stage and live weight, not age.
The age classes
| Species | Classes |
|---|---|
| Sheep | Lamb (up to 180 days), Young sheep (181 to 365 days), Adult (from 366 days) |
| Goats | Kid (up to 180 days), Young goat (181 to 365 days), Adult (from 366 days) |
| Cattle | Calf (up to 160 days), Weaned (161 to 365 days), Young stock (366 to 730 days), Adult (from 731 days) |
The boundaries follow the Swiss agricultural terminology ordinance, that is the categories you already declare for direct payments.
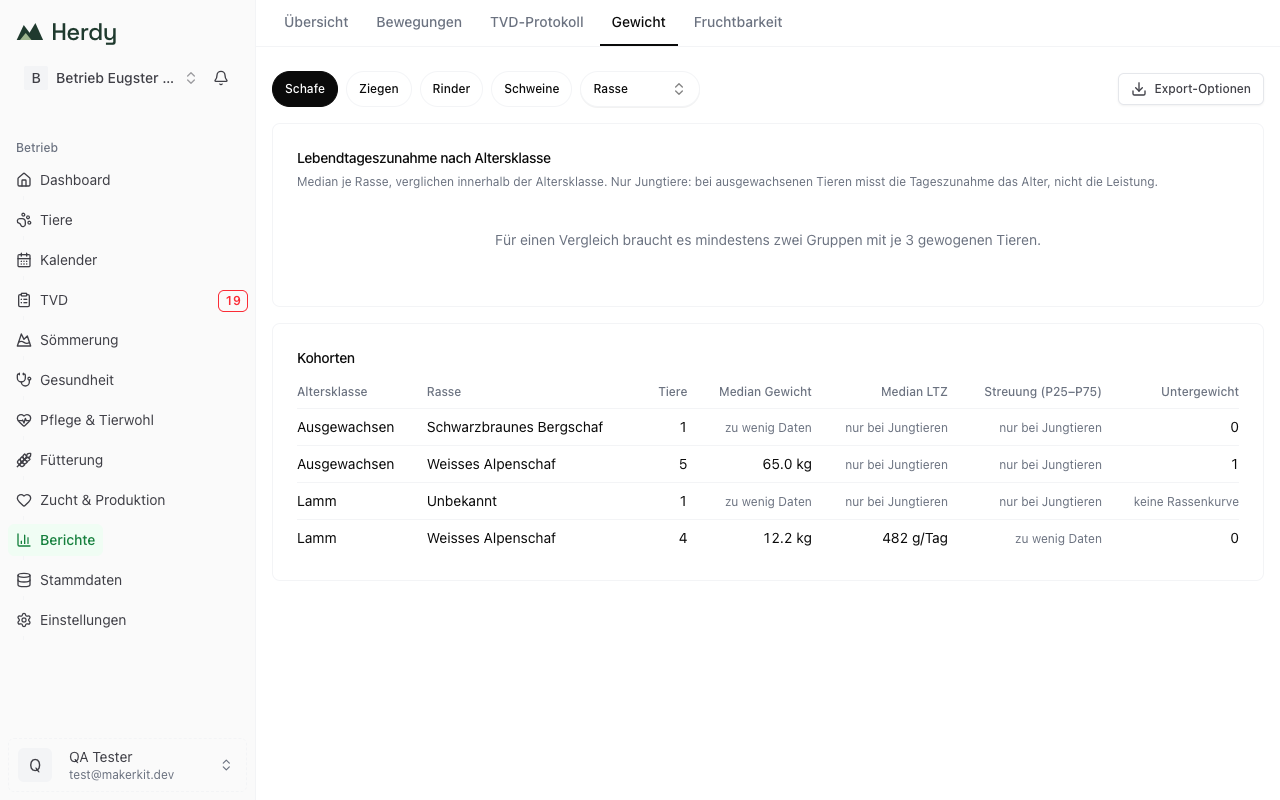
The chart «Daily live-weight gain by age class»
A bar chart with one group per age class and one bar per breed. The axis is labelled in g/T, that is grams per day.
Only groups that are large enough are drawn. If it reads «A comparison needs at least two groups of 3 weighed animals each» instead, you do not yet have enough weighings. A single bar would not be a comparison, only a number in the shape of a chart.
The «Cohorts» table
A cohort is a combination of age class and breed. The table has seven columns:
- Age class
- Breed, or Unknown where no breed is recorded
- Animals: how many animals are in the cohort
- Median weight: the middle value of the most recent weighings, in kilograms
- Median DLG: the middle daily live-weight gain in g/day, followed by the deviation in per cent from the average of the same age class across all breeds. Green means above average, amber below. The deviation only appears when the age class holds at least two reportable cohorts, otherwise it would be a comparison with itself.
- Spread (P25–P75): the range the middle half of the animals falls into. A narrow range means an even group, a wide one means large differences between animals.
- Underweight: how many animals sit below the reference curve for their breed
What the grey notes mean
- too few animals: the cohort has fewer than three weighed animals for a median, or fewer than five for the spread. Herdy deliberately shows no figure rather than turning two animals into a trend.
- young stock only: no daily gain is reported for this row, because the animals are no longer growing or the gain could not be calculated.
- no breed curve: no reference curve is on file for this breed, so no statement about underweight animals is possible.
Export
- Choose the species and, if you like, a breed.
- Tap Export options at the top right.
- Choose Download CSV or Download PDF.
Exported are all cohort rows with age class, breed, number of animals, median weight, median DLG, spread and the number of underweight animals.
Using the analysis
- Weigh the young stock regularly, for example monthly or before weaning.
- Then open Reports > Weight and look at the rows for the young stock classes.
- If a cohort falls clearly below the average of its age class, check that group's feeding, parasite pressure and health.
- A wide spread with an otherwise good median means the average is fine but individual animals are falling behind. Find those animals through the weighing list in the breeding module.